


ABSTRACT
Remote sensing and GIS techniques were used in hydrogeological investigations to interpret physiography, drainage, geomorphology, geology, structural pattern and land use and land cover in Amarja Nala Watershed. It is quite helpful in ground water exploration as the remotely sensed data provides a large area synoptic view with high observational density. Using geomorphological features, areas with high, medium and low potential of aquifers have been delineated. The experience shows that that the percentage of success for locating ground water using satellite imageries increased to almost 90%. As remote-sensing data provides multispectral, multi-resolution images with synoptic view, its use has been increasing for geology and structural mapping and other fields. The different properties of terrain features and their reflectance characteristics produce tonal expressions coupled with interpretative elements, such as tone, shape, size, drainage, texture, pattern, association and shadow etc., when used in conjunction with the existing geological maps and limitedfield checks. The satellite imageries help us to delineate various litho-logical units and structural features. Hence, geological, geomorphological, land use/ land cover and structural features of the area have been prepared on maps using the remotely sensed data.
INTRODUCTION
The Amarja nala is a tributary to the Bhima River of Krishna river basin, lies in between North latitudes 17o 43’ 20’’ - 17 o 09’ 25’’ and East longitudes 76 o 22’ 00’’ - 76o 42’ 25’’ falling in Survey of India toposhets nos. 56 C/6,7,8,10,11and12. It covers an area of 1508.40 sq.kms, of which 1423.40 sq.kms is within Gulbarga district of Karnataka and the rest 85.00 sq.kms, falls in the Osmanabad district of Maharastra state. The area under investigation forms a part of the semi-arid tract Climate is fair and dry. Summer begins from the end of February and ends in the month of June. Temperature ranges from 20oC to 47oC. The monsoon commences in June and continues till the end of October month. The area receives an average annual rainfall of 650 mm. Cold weather prevails during December and January months. The study area experiences one or other type of drought. Rainfall is erratic and wide variation in space and time is observed and The intensity of rainfall is high in the southwestern and northeastern part. The Amarja nala basin, comprised of Deccan basalts, is located between the Karanja and the Bhima rivers.
SPECTRAL SIGNATURE
Remote sensing, encompassing the study of satellite data, is a powerful technique for exploration, mapping and management of earth’s’ resources. The basic principle involved in remote sensing is that each object depending upon its physical characters reflects, emits and absorbs varying intensities of radiation at different EM wavelength ranges. Using information from one or more wavelength ranges it is possible to discriminate between types of ground objects (e.g. water, dry soil, wet soil, vegetation, rocks, etc.) and map theirdistribution on the ground. One of the important remote sensing techniques is areal photography. Aerial photography has essentially remained to be the visible part of Electro Magnetic spectrum, where it is only a very small fraction of the EM spectrum. The values of spectral characteristics over different well-defined wavelength intervals are called ‘Spectral signature’ of the objects by which they can be uniquely distinguished.
COMPONENTS OF REMOTE SENSING
Remote sensing involves three components viz., source of energy (transmitter), target (object of the earth) and the sensor (sensing device). Remote sensing involves transmission of Electro Magnetic Emission from source of the earth surface and its interaction with intervening atmosphere, interaction of energy with the earth’s surface, transmission of reflected energy to the sensor spaced at a suitable platform, detection of energy bythe sensor, converting into photographic maps, Transmission of sensor output data to recording station, processing and generation of data products, collection of ground truth and collateral data analysis and interpretation. The information obtained through remote sensing is usually represented as image either in the form of photograph (analog) or digital format. A photograph is an image formed by electromagnetic radiation detected by photo generative chemical on film.
SENSOR CHARACTERISTICS
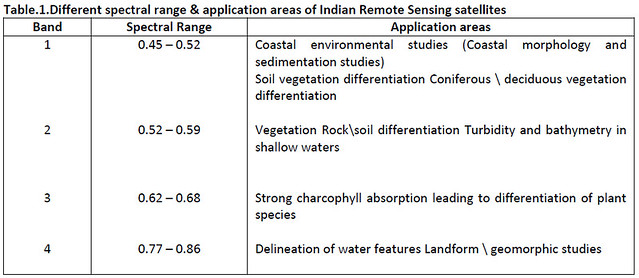
The IRS (Indian Remote Sensing) satellites are important elements of National Resources Management System (NNRMS) and serve national goal in terms of providing continues and operational remote sensing data service for effective management of India’s natural resources (NRSA, 1989). The successful launch of IRS-P2 in 1994 and IRS-1C in 1995 heralded the era of spectral remote sensing programs in our country. In the presentstudies IRS 1B, IRS 1C’s False Color Composite (FCC), geo-coded products are used. The different spectral ranges that are applicable for identification of different natural resources are presented in Table.1.
VISUAL INTERPRETATION
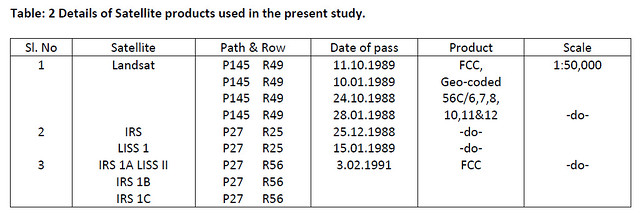
IRS-1B satellite image on 1:50,000 scale has been subjected to visual interpretation using certain fundamental photo elements viz., color, tone, shape, texture, pattern, location and association, shadow aspects and resolution. The base map has been prepared on 1:50,000 scale, using Survey of India topo-sheets of the study area, overlaying on satellite image, using the image characteristics, the information relating to drainage, geology and structure, hydro-geomorphology, land use/land cover, have been derived. Various thematic mapsare prepared by combining the natural resource information together with ground truth information and existing collected data. The maps are digitized using MAP INFO GIS, software. Conventionally, groundwater maps are prepared by manually interpolating the ground water levels. Presently, the maps are also prepared using GIS and other interpolation. In GIS and interpolation software’s, the krigging is often used in interpolation method. The satellite data products used in the present study are given in the Table.2.
 Digital Image Processing (DIP): The image processing software in remote sensing applications can be broadly grouped into as data input routines, pre-processing routines, image display routines, image enhancement and filtering routines, classification routines and out put routines. An idealized sequence for digital analysis can be broken up in to 4 specific groups- Pre-processing preparation operations- preparing satellite data for subsequent analysis. Enhancement- the enhancement operations are normally prepared on image data prior to visual interpretation effects and Data presentation.
The geographic data may be visualized map or value map (two-dimensional or three-dimensional). In the visualized map, the geographic data may be displayed in color, gray tone, as shades or as symbols. The area or raster data can be displayed in color and gray tones. Different classes or values can be assigned different colors or gray shades. For value maps e.g. elevation, soil, pH, groundwater depths etc., and the color may be assignedautomatically. In the standard color schemes, the colors are assigned from blue to red and the intensity in each color changes from low to high as the values in the geographic data increase. In other schemes, the colors are assigned among violet, indigo, blue, green, yellow, orange, and red. The intensity in each color is increased with increase in the geographic data values. In the present study some of these techniques have beenEmployed.
REMOTE SENSING IN GEOLOGY AND STRUCTURAL STUDIES.
Remote sensing studies have emerged as powerful and useful tools in geological and structural studies. Aerial photos and satellite imageries are excellent products used extensively for geology and structural mapping. Geological Survey of India has been using aerial photographs since 1967, for geological studies. National Remote Sensing Agency has started using False Color Composites (FCC) since 1973 for various natural resources applications including geology, structural mapping and hydro-geomorphological mapping.
Lithology is an important determinant in ground water potential mapping. The maps are prepared using remotely sensed data. Various rock types are very well visible on the data. It is possible to observe them due to difference in spectral signature in vegetation, erosion and pattern etc., after litho logical units are differentiated, the structural mapping is done. In the structural mapping dips, fractures and joints are mapped. Lineaments are linear features, clearly visible on the remotely sensed data. These are visible due to sudden changes in the vegetation, spectral signatures and drainage etc., It is evident that, remote sensing and GIStechniques have limited but decisive role to play in groundwater investigations since sub-surface features are manifested on the surface in a synoptic view more information is revealed. The visible and infrared techniques are more in use presently.
The details of satellite products used in the preparation of geological and structural interpretation maps of the study region are presented in the Table.2. The F.C.C products are subjected to visual interpretation techniques. The various geological and structural units are delineated and digitized using MAP INFO GIS software.
Joints are the important structural features, normally well developed in systems or groups, which are essentially linear features, which can be discernible from the satellite imageries. The strike direction of joints in the region varies between N500W to S500E. The major trend directions of joints and fractures are N450 W –N450 E, N500E-S500W and E-W directions.
Lineaments are relatively large linear features, which can be identified from remote sensing data, aerial photos, and geological and geophysical maps. Lineament studies are useful in groundwater exploration and engineering applications (Bonham & Graeme 1994). It is also defined as a large-scale linear feature, which expresses itself in terms of topography and an expression of under lying structural features like faulting, jointing, displacement and abrupt truncation of rocks. Pradeep. K.T (1998), have stated that the lineaments delineated from the remote sensing data provides important information and sub-surface features that maycontrol the movement and storage of groundwater. Sharma (1979) is of the opinion that sub-surface permeability is a function of density of fractures and lineaments. Therefore, delineation of lineaments and their analysis especially in hard rock areas is of great importance in hydrogeological studies.
Satellite imageries are being extensively used to delineate fractures/lineaments, and their analysis for groundwater studies. The identification of dense areas of neo-tectonic lineaments and their intersections from satellite imageries are useful in exploration of fresh water zones (Bakliwal and Ramaswamy 1987). In the present study, lineaments have been delineated through visual interpretation of geo-coded FCC of IRS 1B &1C satellite imageries. The lineaments are represented in the form of strike frequency diagrams, having differenttrend directions and varying dimensions.
Higher lineament density lies in the area where secondary porosities like joints and fracture are mapped. In the present region of study higher density of lineaments are observed in the south and middle portion of the basin, suggesting good groundwater potential. From the lineament density map it is inferred that the area having higher density in terms of length and number of lineaments, which are associated with higher secondary porosity and are likely to yield high discharge of ground water. Thus, these maps will help to narrow down the areas for taking up geophysical investigations at micro-level.
REMOTE SENSING IN GEOMORPHOLOGICAL STUDIES
Based on geology and groundwater conditions the geomorphologic units are divided into valley fills, floodplains, moderately and shallow weathered pedeplains and denudation hills. Among these hydrogeomorphic units valley fills, floodplain units form good ground water prospect zones followed by moderately shallow weathered peneplains. Certain geomorphological features e.g. flood plains; paleochannels are very good ground water reservoirs. They are also very good locations for induced recharge. The geomorphologicalfeatures can be mapped from remotely sensed data. Water is seen as blue to black in color on the FCC. The aquifers are formed in weathered and fractured zones. The fractures and faults are manifested in terms of linear features on the satellite images. River channels are oriented along these features. There may be a tonal difference in soil, vegetation/slopes/topography across which are manifested on the satellite data.
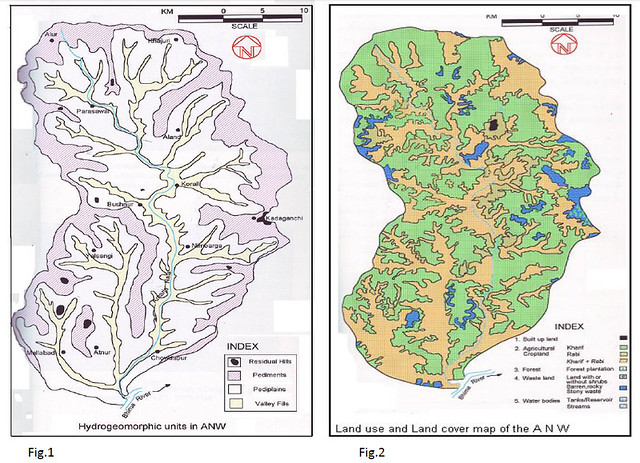
Geomorphological mapping e.g. mapping of pediments, buried pediments, valley fills and their characterization is very useful in ground water investigation. Ground truth is needed for mapping pediments. The above features have increasing order of ground water potential. The areas having ground water potential may have anomalous exuberant vegetation. Thus the study of the hydrogeomorphology using remote sensing technique has much utility in ground water studies. Hence, it has been used in the present study and it is briefly described below(Fig.1)
Residual hills are the end products of the process of pediplanation, which reduces the original mountain masses into series of scattered knolls on the pediplains (Thornbury, 1955). They occur as isolated hills with considerably small areal extent formed at lower altitudes as compared to the denudational hills. The image characteristic feature of these landforms is darker in tone, coarse in texture, mostly circular in shape, devoid of any vegetation. Due to steep slopes, most of the rainwater escapes as runoff immediately without much infiltration and hence the ground water prospects are poor in these units. Residual hills are observed in the Amarja nala watershed around Kadaganchi, Revur, Yelsngi, Nirgudi, and Allapur villages.
Pediments: Pediment is the transition zone between the hills and adjoining plains. They are better developed in semi-arid climate. The slope varies from 1 to 70. The pediments are shaped by erosion and transportation affected by sheet floods. The dissected pediments are subsequently smoothened by weathering and sheet floods. It is a gently sloping smooth surface of erosional bedrock with or without thin cover of detrital materials. In the present study area, pediments are developed over the basaltic terrain. On the satelliteimagery these are observed with light photo tones, coarser texture, devoid of any vegetation. These are well seen around Chincholi, Kerur, Allapur, Mogha’K’ and Kadaganchi villages. In the pediment regions of the area, a yield of groundwater structures is moderate.
Pediplains: Bryon (1950) proposed the concept of pedeplanation. The pediplain is most generally used to describe a series of coalescing pediments (Thornbury, 1955). Pediplains are the products of pedeplanation. The individual landforms developed differ considerably depending upon insitu conditions such as bedrock, topography, geological structure and geomorphic process acted upon them.
In the present study area pediplains are identified based on image characteristics, like tone, texture, vegetation etc., using FCC images. Moderately weathered peneplain is a flat to gently undulating plain terrain with 5 to 10 m weathered material are covered with mixed soils. These hydro-geomorphic units are spread over most of the area. These are traversed by fractures and lineaments. In general ground water prospects are moderate to good. Good yields are expected along the fracture/ lineaments and their interconnections. Largenumbers of dug-cum-bore wells are located in these units. The yields of bore wells vary from 75 to 150 lpm. Large variation in yields can be attributed to the proximity to the fracture and their interconnections. The slopes of streams vary from o to 2%.
Shallow weathered pediplains are gently sloping surface of weathered peneplain with 0 to 10 m thickness; weathered materials are covered with mixed soils. They give rise to medium to coarse texture on the satellite image. These landforms are spread over the entire basin and occupy large part of the basin. Vast area of these landforms is found to occur on either side of stream courses. Fractures and lineaments at many places truncate them. The ground water prospects are poor to moderate. Groundwater yield is in the range of 50 to100 lpm (i.e moderately good).
Moderately weathered pediplain is a flat to gently plain terrain with 5 to 10 m-weathered zone covered with mixed soils. These hydrogeomorphic units are observed to occupy most of the area. These are traversed by fractures and lineaments. In general groundwater prospects are moderate. Good yields are expected along the fracture/lineaments and close to their inter sections. Large numbers of dug-cum-bore wells are located in these units. The yields of bore wells vary from 75 to 150 lpm. Large variation in yields can be attributed to the proximity to the fracture and their interconnections. The slopes of streams vary from 0 to 2%. Majority of the dug wells are found dry during the summer period. In general ground water quality is suitable for domestic and irrigation purposes.
 Deep weathered buried pediplains are flat and smooth surface of weathered pediplain, with 10 to 20 m thick weathered zone covered with black cotton soils. These units are often traversed by fracture and lineaments at many places. Ground water prospects are moderate to good. Groundwater yields are in the range of 50 to 150 lpm. These landforms are observed in the vicinity of Bhosga, Koralli, Dicksangi, Dhotargaon and Lad-ChincholiVillages.
Valley Fills (VF): These landforms are observed in the fluvial domain of geomorphological set up of the area. These are mostly controlled by fractures/lineaments. They are narrow valley fill with fluvial sediments, composed of pebbles, sand, silt and clay. The thickness of valley fills range from 5 to 15 m and is predominantly observed south of Koralli. Ground water prospects are good to very good. The yields depend on the thickness of the fill and structure, fanged from 100 to 250 lpm. A large number dug wells, dug-cum-bore wells and bore wells are constructed in these areas. These areas are observed to be potential zones. Valley fills in the region are highly suitable for construction of water harvesting structures.
LAND USE LAND COVER
Remote sensing technology has made most significant contribution in the area of land use mapping. Data collected by different sensors over various regions of electromagnetic spectrum help in differentiating one feature from the other. Land use feature can be identified, mapped and studied on the basis of their spectral characteristics. Healthy green vegetation has considerably different characteristics in visual and near infraredregions of spectrum, whereas dry bare soil has a relatively stable reflectance in both the regions of spectrum. Thus, by using multi-spectral data different ground features can be differentiated from each other and thematic map depicting land use can be prepared with the satellite data. Land use classification not only involves mapping of the areas of a given crops or cover but also requires identification of specific crops or forest species. Higher resolution multi-temporal and multi-spectral data are ideal for this purpose.
Land use land cover investigations are needed for the optimal utilization and management of land resources of the region. Land use controls many hydrological processes in the water cycle e.g. infiltration, evaporation, surface runoff etc. Surface cover provides roughness to the surface. It reduces the discharge, thereby increasing the infiltration. Many classification systems have been proposed for land use classification. These maps are useful in water resources inventory, hydrological modeling and water management aspects. Thus,they are very good and cost effective source for land use mapping. These maps were prepared using remotely sensed data in the present study (Fig.2)
The characteristics of the land surface- artificial and natural soil cover are differentiated based on tone, texture, pattern, shape, and size, shadow and association. The land use classification system based on understanding the remote sensing techniques can be effectively used to complement traditional surveys for an accurate inventory of land use / land cover and has been developed under NRSA, Dept. of Space. The system isfairly compatible and has been followed by most other government departments in the country. Remote sensing can play a useful complimentary role in managing the land and water resources especially of command area to maximize the production. Multi-spectral satellite imagery in near infrared bands particularly 0.75-1.0 um range is ideal for inventorying of surface water bodies like ponds, tanks and reservoirs. Land use/landcover mapping is one of the important applications of remote sensing. Remote sensing provides excellent information with regard to spatial distribution of vegetation type and land use in less time at low cost in comparison to conventional data (Roy et al., 1973).
Land use classification: Land is one of the important natural resources and is precious asset. Many of the actions related to land and water management focus on influencing the vegetation, land use land cover. Land use refers to man’s activities and various uses, which are carried on land (Clawson & Stewart, 1965). The land use pattern depends upon the geomorphic set up of the area. The cultivable land includes the parts of ridges, slopes, and valleys. The standard classification of land includes, the net area sown, cultivable wastes, forest, current fallow land, pastures and others included under non-agricultural lands. The net area sown is important from the agricultural point of view. Agricultural land is the major economic resource has been providing sustenance to the people. It also governs the population distribution and density of the area. Though agriculture is the backbone of the economy suffers from many set backs like floods and droughts.
The Directorate of Land Records (Statistical abstract. 2001-02) has classified the State broadly in to following 5 categories viz., forests, land not available for cultivation, and other uncultivated land excluding fallow land, fallow land and net area sown. Forests of the land covered under forests include the natural forests of the forest area along roadside, railway tract and canal. Land not available for cultivation: This includes land put to non-agricultural uses, barren, and uncultivable land. Other uncultivable land: This excludes the fallow landand includes permanent pastures, and other grazing land, land under miscellaneous tree crops and groves not included in the net sown area and culturable waste. Fallow land includes fallow other than current fallow. Culturable land, which remains uncultivated during the current year are to be, termed as current fallow. Net area sown is the total area sown in the watershed.
The land use and land cover map of the Amarja nala watershed has been prepared using the FCC images through visual interpretation based on the classification decoded by NRSA (1989). The moderately undulating to gently sloping lands, which are chiefly used for cultivation and areas with badland topography are mostly unfit for cultivation. The study area falls in rain fed crop condition and the changes in the amount and intensity of rainfall received in a year brings considerable variation in land use. Water availability forms the chiefcriterion in the land use. This can be divided into seasonal surface sources and groundwater sources. Based on the availability of water, the cultivable area may be classified into monsoon cropping rain fed areas of seasonal surface sources and multi cropping cultivable areas of permanent surface water sources and ground water sources. The soils are one of the important factors in determination of land use. The nature of vegetation as well as crops grown varies.
The areas of different land use and land cover classes/types in the region are computed and presented in the Table.3 and a brief description is given below. The built up land under this category is not meant for agricultural purposes. Land used for human habitation covers building, transport, communication and utilities associated with water, vegetation and vacant lands. Major settlements in the study area are Aland City and other village habitations are delineated and they constitute an area of 3.08 sq.km of the total area of the watershed.
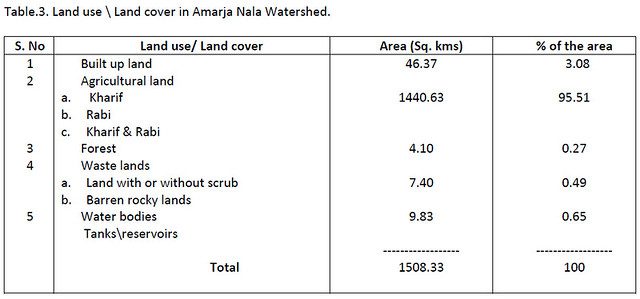 The agricultural land primarily used for farming and for production of food and other commercial and horticultural crops. It includes irrigated and non-irrigated cropland, fallow and plantations. It covers an area of 1440.63 sq.km and constitutes 95.51% of the study area, which includes the following. Kharif non-irrigated croplands are associated with rainfed crops under dry land farming with limited irrigational facilities. Crops like bajra, jawar, grams, groundnut, and cotton are grown. This is the major land use in the area. Double-croppedareas are the lands with assured irrigation facilities in the form of surface and groundwater. It covers an area of 780 sq.km of the watershed and accounts for 53%. They spread over the entire area mostly along the stream courses and fracture zones valley fills and flood plain areas. Major part of the double/ cropped area are irrigated by the ground water through dug wells, dug cum bore wells and bore well and mostly confined to valley fills, flood plains and along the stream courses, which have less than 2% slope.
Forests covers negligible areal extent, constitute an area of 4.10 sq.km. The wasteland includes land with or without scrub, covers an area of 7.4 sq.km. These are mostly confined to foothills and upland areas. They are usually associated with steep slops. These lands often support grasses and scrub and account for 0.49 % i.e. about 7.4 sq.km. A number of water bodies (tanks) with varying sizes and are present in the study occupy 9.83sq.km. Most of the tanks rarely get filled up and are dry during summer seasons. They are mostly minor irrigation tanks; contribute to subsurface water in the form of recharge. A good number of dug wells, dug-cumbore wells and bore wells are located on the down streamside of tank bunds.
YIELD OF ABSTRACTION STRUCTURES
The success rate of wells located in valley fills and floodplains is promising. The percentage of success is also high in areas falling in moderately weathered zones. The success rate of wells located in the pediment zones is very less and yields are relatively low. In the moderately weathered pediplain, the yield variation is quite significant. Only those bore wells, which are associated with lineaments, are more successful. The relation ofwell yields with lineaments, drainage and slope were studied.
Yield and lineaments: It is interesting to compare well yields with the presence of lineaments. The distribution of wells with respect to lineaments (intersection on the lineament, near the lineament, away absence of lineament) studied. The bore wells associated with lineaments and intersections are successful with high yieldsof 200 to 400 lpm. Bore wells that are not associated with any lineaments (in recharge areas) are dry or yield is less than 75 lpm.
Drainage and yield: Amarja nala watershed is the 6th order river micro basin. The distribution of wells with respect to stream orders and well yields are studied. Wells, which are associated with Ist order streams show low yields in the range of 5 to 20 lpm. It is seen that wells located near higher order streams are more successful due to their large catchments.
Yield and slope: The basin has been classified into 7 classes and their areal extent as well as well yields has been studied. First category of 0 to 1 % slope accounts for 65% of the total basin area, followed by very gently sloped class. It is clear from the figure the steep slope areas are associated with low yields. However, it is a fact that in various geomorphic units’ presence of lineaments is the major controlling factors for variation in the yields of wells observed. Well yield is good in the valley areas.
Well yield and Electrical resistivity: Well yields were compared with vertical resistivity sounding data. Higher resistivities of more than 100 ohm/m are a characteristic feature of hard and massive rocks. The top layer is a soil cover with resistivity between 10 - 30 ohmm. This is followed by a weathered layer having resistivity ranging between 20 - 80 ohmm. Water saturated fracturedweathered zones are found to have resistivity varying between 20 - 80 ohm/m. Red-bole beds are characterized by varying resistivity. Resistivity range between 30 - 50 ohmm are found to be associated with productive zones. Remarkable decrease in water yield is observed with increase in resistivity of fractured zones.
GEOGRAPHIC INFORMATION SYSTEM (GIS)
The demarcation of potential zones using Remote Sensing data and GIS, gives valuable results (Krishna Murthy & Sreenivasa,1995). The manual on GIS for the planners and decision-makers explains that GIS allows the handling and manipulation of data in both spatial and non-spatial format. The power of GIS is in organization of spatial data information system and orients them towards decision-making or resource management. All ofthese are based on the concept of an emerging discipline, “spatial science”. GIS is used as a tool for integrating large and different data types and it is enhancing our capability to manipulate and analyze this information for planning and decision-making. Ground water occurrence in any region mainly depends on litho logy, structure, topography and precipitation. Because of complex nature of groundwater occurrence and movement, it needs an integrated approach (Krishna Murthy & Sreenivasa,1995).
GIS has been one of the powerful techniques in assessing the suitability of land. Remote sensing and Geographical Information System could be effectively used in mapping, monitoring and management of natural resources (Ramachandran, et.al. 1998). In the present study, GIS technique has been utilized for the delineation of ground water potential zones by integrating thematic layers.
CONCLUSIONS
1. Landfills are quite narrow, mostly observed south of Koralli and cover negligible areal extent.
2. Forest covers just 4% of the geographical area, represents far below the national average of 21%.
3. Higher density of lineaments are observed in south and middle portion of the basin, suggesting good groundwater potential around these regions.
4. The strike direction of joints in the region varies between N450W-S450E, N500E-S500W and E-W directions.
5. Four major geomorphic units are identified viz., Residual hills, Pediments, Pediplains and Valley fills, of which pediments and pediplains occupy 80% of the total geographical area and have yield range of 50 to 100 lpm.
6. Valley fills are structurally controlled geomorphic units and are composed of pebbles, sand, silt and clay are mostly suitable for large dia wells.
7. Double cropped area covers 53% of total geographical area of the watershed, mostly irrigated by dug wells, bore wells and dug-cum-bore wells.
8. Surface water bodies cover less than 1% of total geographical area. Thus recharge from these water bodies are limited.
9. Residual hills resistant ridges are low groundwater potential zones, because in these regions runoff is more when compared to infiltration.
10. Agriculture land covers 95.5%, where as built up land covers only 3.08% of total geographical area.
11. Thus the satellite data used in the study is to be of useful in delineating hydrogeomorphic units and lineaments and to demarcate groundwater potential zones.
REFERENCES
- Bakliwal, P.C and Ramaswamy, S.M (1987), Lineament fabric of Rajastan and Gujarat. Records. of GSI. 113(7), 54-64.
- Bohman-Carter, Graeme, F, 1994. Geographic Information System for Geoscientists, modeling with GIS, Pergamen, Canada.
- Clawson. M and Stewart (1965), Landuse information committee on Landuse statistics, resources for future. The Jhon Hopkins Press, Boltimore, USA. 212 p.
- Directorate of Land Records (2002), Government of Karnataka
- Krishnamurty, J and Sreenivasa, G (1995), Role of geological and geomorphological features in groundwater targeting. Spl. Issue on remote sensing for national development. Curr. Sci. 61; 172-179.
- NRSA (1989), A report on National land use and land cover classification using remote sensing.
- Pradeep, K.T (1998), Remote-sensing techniques to locate groundwater potential zones, in upper Urmil river basin, district. Chatarpur. Central India. Jour. Ind. soc. Remote sensing 26(3), 135-147.
- Ramachandran, S, Sundarmurthy.S, Krishnamurthy. R, Devasenapthi, J and Thanikachalam, M (1998), Application of Remte sensing and GIS, to coastal wet land geology of TN and Andaman & Nicobar group of Islands with special reference to Mangrooves. Curr. Sci. 75(3). 236-244.
- Roy, A.K and Raina. B.N (1973), Hydrogeological studies of Kotepally catchment in Hyd, AP. Based on areal photographs. International. sym. Develop. Group resours. V-1, pp 13-27.
- Sharma, R.K (1979), A textbook of hydrogeology and water resources, Dhanpet Rao & Sons, Delhi, pp 13-19.
- Thornbury. W.D (1955), Principles of geomorphology, widely toppan, New York.
D. P. Reddy
Central Ground Water Board, Guwahati
Posted by


