


Abstract: Pond (locally called Talab) water is very essential constituent for living being. It maintains water table, temperature, drinking purpose, domestic and irrigation demand for the city. The present water testing aim is for evaluating the water quality of various ponds in Raipur city, capital of Chhattisgarh. Testing and analysis of pond water samples were analyzed for various physicochemical characteristics such as turbidity, pH, total alkalinity, chloride, total hardness, total dissolved solid, dissolved oxygen, Biological Oxygen Demand (BOD) and total coliform. Out of these nine ponds is most polluted. All these water bodies are not suitable for domestic and drinking purposes, therefore proper treatment is necessary before can be suitable for domestic use.
1. Introduction
Climate change has created an irregular pattern in the seasons in past years. Last few years are known for extreme weather phenomena which have contributed to increased scarcity of availability of water and energy resources (Grant et al., 2012 and Vorosmarty et al., 2010). Likewise other part of India, Chhattisgarh is also depends largely on Monsoon rainfall for its demand of water. Therefore, the resources such as reservoirs were built after independence. However, traditionally Chhattisgarh is known for its pond, locally also called as Talab has been integral part of Chhattisgarh’s heritage. There are many ponds located surrounding area of the capital city “Raipur”.
Compared to flowing river, pond is more prone towards the pollution due to stagnant water bodies. There are various source of contamination to these ponds. Any contamination affects the flora and fauna in addition to human health if the water is used for domestic supply. Fresh water is one of basic needs for survival of human being. Most of fresh water bodies all over the world are getting polluted, thus decreasing the portability of water (Gupta S,2008). Pond is important for ecology and much significance in environments such as (i) Wild life habitat (ii) rain water harvesting (iii) Surface and ground water recharge (iv) flood control (v) food and nutrition for many organisms, etc.
However, the water of the ponds, lakes and river are polluted mainly due to discharged waste water from residential areas, sewage outlets, solid wastes, detergents, automobile oil wastes, fishing facilities and agricultural pesticides from farm lands (Bhuiyan JR, 2007). The large scale urban growth due to increase in population or migration of people from rural areas to urban areas has increased domestic effluents while industrial development manifested either due to setting up of new industries or expansion of the existing industrial establishments resulting in generation copious volume of industrial effluents (Verma AK,2010). In the present work, water qualities were evaluated of main ponds around the city of Raipur.
2. Geographic Location
The present study is focused on the ponds of Raipur city, capital of Chhattisgarh, India. Raipur city is situated in the fertile plains of the Mahanadi River basin in Chhattisgarh state. Algal bloom was observed in pond water from last few years. There is a problem such as swallowing of pond was also faced in past few years in addition to increased in improper sanitation. In the present paper, following main city ponds were selected for water quality testing; Ayyappa Talab, RamKund, Vevekanand, Karbala, Amma Katora, Bhuiya, Ghorani and Housing Board Saddu.
3. Materials and Methods
3.1 Methodology and sample collection
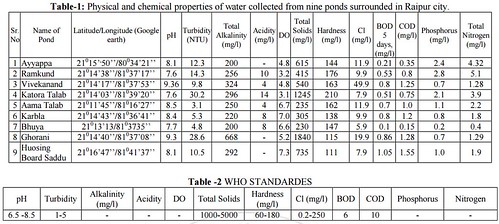
The water samples were collected in plastic bottles, in the month of October-2015 after monsoon season from nine ponds and labeled as sample 1,2,3…..9 (Table 1). All parameters determined using standard methods described in APHA. The analyzed result of each sample was compared with World Health Organization (WHO) standard.
3.2 Water quality parameters
The water samples were collected from each pond mentioned in Table 1 for physical and chemical characterization. Analysis was carried out for various water quality parameters such as pH value, dissolved oxygen (DO), phosphorous content etc. and results are mentioned in Table 1. Standard methods (American Public Health Association 1995) were used for sampling, preserving, transporting, and analysis. Freshly prepared distilled water was used for preparing standard in all experiments. The pH of samples was used for pH meter. Turbidity was measured by digital turbidity meter. Total alkalinity, acidity & hardness were determined by titrimetric method. The dissolved oxygen (DO) and the Chemical Oxygen Demand (COD) were measured by Winkler’s method and closed refluxed method, respectively.
Phosphorus and total nitrogen were measured by spectrophotometer [Double Beam] and Total Kjeldahl Nitrogen method, respectively.
4. Results and Discussion
4.1 pH measurement
The pH was measured by pH meter. The pH values varied from 7.6 to 9.36 during October month. Among all the ponds, pH of Vivekanand and Ghorani were highest. Water with pH below 6.5 corrodes the pipes, thereby releasing toxic metals such as Zn, Pb, Cd and Cu etc. (Trivedi, R.K,2006).
4.2 Turbidity
The suspension of particles in water interfering with passage of light is called turbidity (Hemlata Mahobe, 2013). Turbidity is varies from 3.1 to 30.2. The visual analysis shows that higher turbidity was observed due to green moss. The concentration is high which may be due to addition of solids from runoff water, sewage, municipal effluents and other domestic effluents directly to the pond (Jain S.M,1996).
4.3 Alkalinity
Alkalinity is a measure of the ability of water to neutralize acids and varies from 200 to 668 mg/l. In large quantities, alkalinity imparts a bitter test to water (Howard S.Peavy).
4.4 Acidity
Acidity is varies between 4 to14 and almost nil in water
4.5 Dissolved Oxygen (DO)
The amount of dissolved oxygen present is most important. As DO drops below 4 to 5 mg/l, the form of life that can survive begin to reduce (Gilbert M.). The DO level in sample is 3.1 and 3.2. Occurrence of low DO value has been attributed to the process of decomposition of organic matter involving the utilization of oxygen (Hemlata Mahobe,2013).
4.6 Total Solids
The composition of solids present in the natural body of water mainly depends upon the nature of the bed rocks and soil developed from it (Nighojkar Abhineet,2014). Solids are enhancing due to decomposition of organic matter present in the water body. It varies from 230 to 1840 mg/l in sample.
4.7 Total Hardness
Hardness is defined as the concentration of multivalent metallic cations in solution (Howard S.Peavy). In the present study it is varies to 111 to 176 mg/l.
4.8 Chloride
The high concentration of chloride is considered to be an indication of pollution due to high organic waste of animal origin (Trivedi P,2009). Chloride is almost low range from 7.9 to 49.9 mg/l
4.9 Biological Oxygen Demand (BOD)
The amount of oxygen consumed during microbial utilization of organics is called the Biochemical oxygen Demand (BOD) (Howard S.Peavy). BOD indicates the prances of microbial activities and dead organic matter on which microbes can feed. An inverse relationship was found between the dissolve oxygen concentration and BOD value (Coscun.I.1989).
4.10 Chemical Oxygen Demand (COD)
COD test determined the oxygen required for chemical oxygen for organic matter. In the samples, the values were varied between 0.3 to 1.55 mg/l.
4.11 Phosphorus content
Phosphorus (P) is generally considered to be the limiting nutrient for plant growth in freshwater with small quantities occurring naturally mainly from geological sources. Phosphorus in natural waters & wastewaters is usually found in the form of phosphates (PO43) (APPENDIX 7). Phosphorus is an essential nutrient for the plants and animals that make up the aquatic food web. Phosphorus is an essential element for plant life, but excess amount of phosphorus in water accelerate problem such as eutrophication (Sumant Kumar, 2015)
4.12 Total Nitrogen
This is a measure of all forms of nitrogen (organic and inorganic). The importance of nitrogen in the aquatic environment varies according to the relative amounts of the forms of nitrogen present, be it ammonia, nitrite, nitrate, or organic nitrogen (APPENDIX 7). Nitrate concentration in groundwater and surface water is normally low but can reach high levels as a result of agricultural runoff, refuge dump runoffs, or contamination with human or animal wastes (Nas, B, 2006). It varies in sample from to 0.4 to 5.1 mg/l.
5. Conclusions
Water quality problem on pond are increased due to rapid development in urban area. In this study, the water quality tests show that turbidity of all the ponds are higher up to 5 fold than standard values expect for Aama and Bhuya Talabs. The chlorine test shows that all ponds have higher content of chlorine than described values. Higher pH should be neutralized. Higher value of turbidity (above 5), Total Solids, phosphorus and total nitrogen made ponds water contamination. Value of phosphorus and nitrogen is good for aquatic plants. The Pond water quality may be increased by stopped the sewage water and proper disposal of pet, animal waste. The BOD level is relatively low compared to the standard, which has direct impact on biological decomposition of dissolved organic matter to occur under aerobic condition. There was no sign of E.coli bacteria in all samples, which is beneficial for human and animal health.
6. Acknowledgements
The authors are thankful to Department of Civil Engineering in National Institute of Technology Raipur, Chhattisgarh, India. Arvind K. Swarnakar thanks to Rakesh Kumar Sharma (SDO,WRD E/N, Durg district) for his support for this work.
References
[1] S.B. Grant, J. Saphores, D.L. Feldman, A.J. Hamilton, T.D. Fletcher, P.L.M. Cook, M. Stewardson, B.F. Sanders, L.A. Levin, R.F. Ambrose, A. Deletic, R. Brown, S.C. Jiang, D. Rosso, W.J. Cooper, I. Marusic “Taking the “waste” out of “Wastewater” for human water security and ecosystem sustainability” Science, 337 (6095) (2012), pp. 681–686
[2] C.J. Vorosmarty, P.B. McIntyre, M.O. Gessner, D. Dudgeon, A. Prusevich, P. Green, S. Glidden, S.E. Bunn, C.A. Sullivan, C.R. Liermann, P.M. Davies Global threats to human water security and river biodiversity, Nature, 467 (7315) (2010), pp. 555–561
[3] Appendix 7: information on water quality parameters, (www.inab.ie).
[4] Bhuiyan JR, Gupta S. A comparative hydro biological study of a few ponds of Barak Valley, Assam and their Role as sustainable water resources. J Environ Biol. 2007;28(4):799-802)
[5] K. Coscun.I.,Yurteri,s.,Mirat.T.and Gurol,D., (1989). Removal of dissolved organic concentration by ozonation, Env. Progress, 6(4), 240-244.
[6] Gilbert M. masters Introduction to Environmental Engineering And Science ,Prentice Hall of India Private Limited, New Delhi
[7] APHA, Standard methods for the examination of water and wastewater. American Public Health association (19th ed.1995), Washington DC, 2003
[8] Gupta S, Maheto A, Roy P, Datta JK, Saha RN (2008) Geochemistry of groundwaterBurdwan district, West Bengal India. Environ Geol 53:1271–1282.
[9] Hemlata Mahobe , Study of Physico-Chemical Characteristics of Water Ponds of Rajnandgaon Town, Chhattisgarh, International Journal of Scientific & Engineering Research, Volume 4, Issue 8, August-2013 738 , ISSN 2229-5518
[10] Howard S.Peavy ,Donald R. Rowe, Environmental Engineering ,McGro-Hill International Edition
[11] Jain S.M., Sharma M. and Thakur R. (1996). Seasonal variation in physico-chemical parameters of Halai reservoir of Vidisha district India. Indian J. Ecobiol., Vol. 8(3), 81-188
[12] Nas, B., & Berktay, A. (2006) Groundwater contamination by nitrates in the city of Konya, (Turkey): A GIS perspective. Journal of Environmental Management, 79, 30–37
[13] Nighojkar Abhineet And Er.D.Dohare ,PhysicoChemical Parameter for Testing of Present Water Quality of Khan River at Indore, India International research journal of Env.Sci. ISSN 2319-1414 Vol.3(4),74-81, April (2014)
[14]S. Venkateswaran, M. Elangomannan, M. Suresh, Prabhu MV. Evaluation of Physico-Chemical Characteristics in Groundwater Using GIS –A case Study of Chinnar Subbasin, Cauvery River, Tamil Nadu, India. CLEAR IJRAGS.
Author Profile
Arvind K. Swarnakar received the B. E degree in Civil Engineering from Govt. Engineering College Bilaspur (C.G) in 2002 and currently pursuing his M.E degree in Environmental Engineering from Bilai Institute of Technology, Durg (C.G).
Posted by


