


ABSTRACT
Geographic Information System (GIS) techniques are being increasingly and effectively used in morphometric analysis and groundwater potentiality mapping of drainage basin owing to its capabilities of manipulation, analysis, flexibility of experimentation and ability to extract topological attributes from various thematic maps, and to work as a unique tool for geospatial modelling. An attempt to establish morphometric parameters of Damodar river basin and suitable delineation of groundwater potential zones in Jharia coalfield has beenmade following a multi-criteria evaluation GIS approach using Geomatica and SPANS software tools. The morphometric analysis of the basin reveals that the basin has low to moderate relief, elongated shape and consists of fractured and permeable resistant rocks. For delineation of groundwater potential zones, various data layers such as, litho-stratigraphy, drainage, lineaments (faults), water table elevation, and slope havebeen emphasized because of their relative importance in holding capacity of groundwater amongst other parameters. A multi-criteria evaluation following a Bayesian probability weighted approach has been employed for map overlay analysis that allows a linear combination of weights of each thematic map. The resultant map indicates that the buried river channels in the southwestern part of the coalfield and flood plains and river channels near Damodar river are groundwater potential zones.
Keywords: Morphometric analysis; Geographical information system; Jharia coalfield; Multi-criteria evaluation, Groundwater potentiality.
INTRODUCTION
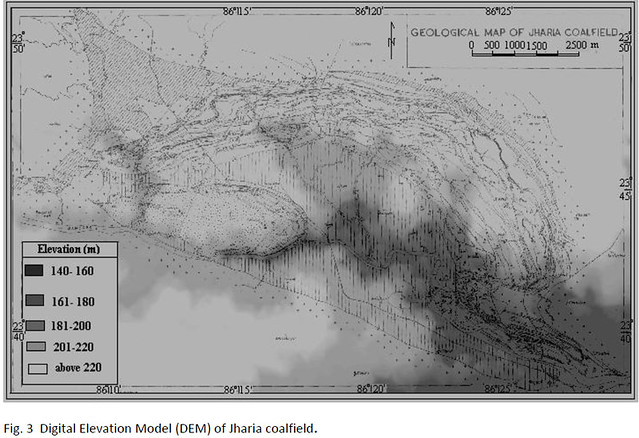
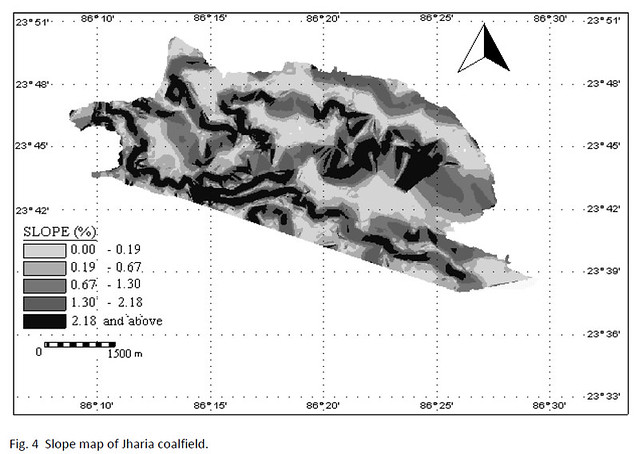
Jharia coalfield, the study area lies between 23°39′ N to 23°48′ N latitude and 86°11′ E to 86°27′ E longitude and is located in the eastern part of Dhanbad district, Jharkhand with an area of about 456 sq. km. It falls within the Survey of India (SOI) Topographic maps 73 I/1, 73 I/2, 73 I/5 and 73 I/6. The area is characterized by the gently undulating to a rolling topography with an overall slope towards east-southeast. The average topographic slope varies from 0.01% to 2.18 % and above. The ground elevation of the area generally varies from 240 m in the western part to 140 m in the southeastern part near the Damodar river (NRIMS, 1995). The entire area is subjected to denudational process. Different physiographic units include hillocks and escarpments, pediplains, monadnocks, valley side slopes and valley flats. Vegetation cover is mainly sparse and degraded in general. Important rock types exposed in the area include sandstone and shale of Gondwana age and Precambrian metamorphics. The Gondwana sediments lie unconformably over the Precambrian metamorphics. The groundwater level is dependent mainly upon the presently existing topography, geomorphic features such as, abandoned channels, etc. and human-induced recharge condition. Due to scarcity of drinking water and unhygienic condition around Jharia coal belt, the active population of the Jharia coalfield faces acute shortage of drinking water, which becomes even worse in the summer months. Some part of the coalfield faces water crisis so much so that the habitants use mine water discharge as potable water. In this context, an attempt has been made to evaluate different morphometric parameters of the Damodar river basin and to delineate suitable groundwater potential zones in around Jharia coalfield.
METHODOLOGY AND DATABASE
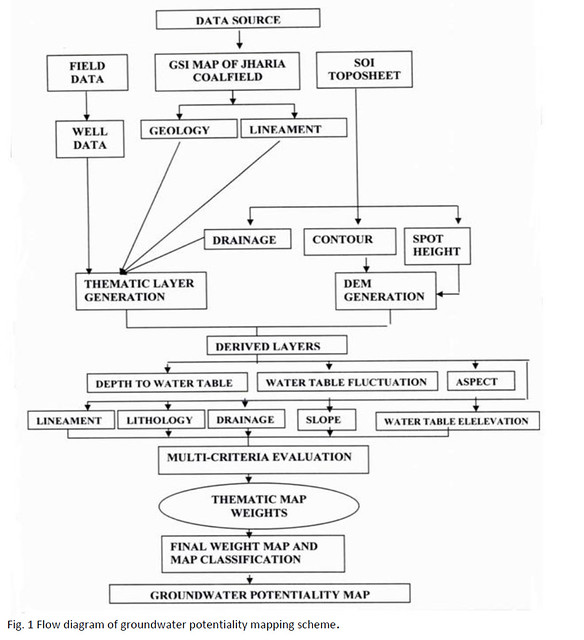
Various thematic maps, viz., litho-stratigraphy, slope, drainage and lineament have been generated using SOI Topography map Nos. 73 I/1, 73 I/2, 73 I/5, 73 I/6 in1: 50,000 scale and Geological Survey of India’s (GSI) map of Jharia coalfield in 1:63,360 scale. Ground truth has been collected on the litho-stratigraphic units through various field traverses. Dug well data have been collected at different locations in and around the Jharia coalfield. Digital Elevation Model (DEM) of the area has been generated from the topographic contours andspot heights. Elevation contour map has been prepared from the DEM. Generation of these layers have followed a step-approach, i.e. digitization, editing, building topological structure and finally, polygonization for GIS overlay analysis. A flow diagram for different thematic layer generation and GIS-based multi-criteria evaluation network is given in Fig. 1.
The database used for generation of different thematic layers includes, (i) contour and spot height data collected from Survey of India’s Topographic maps viz. 73 I/1, 73 I/2, 73 I/5, and 73 I/6 in 1:50,000 scale; (ii) litho-stratigraphic data collected from Geological Survey of India’s (GSI) map of Jharia coalfield (Fox, 1930; Mehta and Murthy, 1957) in 1:63,360 scale; (iii) lineament data collected from GSI map of Jharia coalfield (Fox, 1930; Mehta and Murthy, 1957) in 1:63,360 scale and CMPDI map of Jharia coalfield in 1: 25,000 scale (Vermaet al.1989) and; (iv) dug well data collected from different networking stations in Jharia coalfield.
GEOLOGICAL SETTING
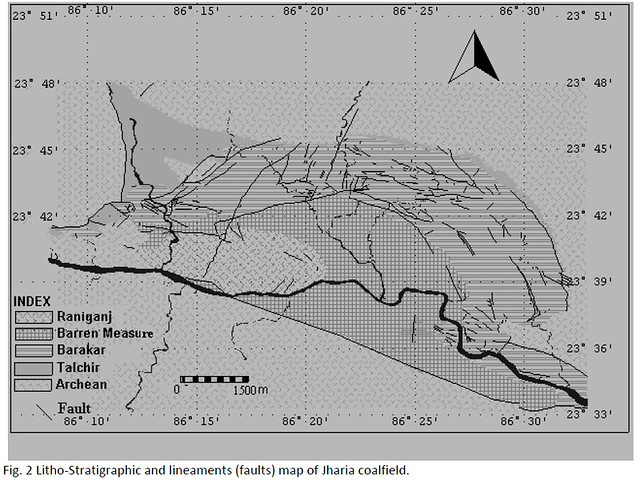
Jharia coalfield with its sickle shape has its longer axis running northwest-southeast. The coal basin extends for about 38 km along east-west direction and for a maximum of 18 km in north-south direction covering an area of about 456 sq. km. The basement metamorphic rocks are overlain by Talchir formation, which is followed upward in succession by Barakar formation (main coal-bearing horizon), Barren Measures, Raniganj formation (the second coal bearing horizon). The litho-stratigraphic map of the area with lineaments (fault system) is given in Fig. 2. Various structures of the coal basin as deciphered from a large volume of surface and subsurface data have been compiled by Verma et al. (1989) and Chandra (1992). Gondwana sediments of Jharia basin are largely disturbed by a large number of various types of fault system. In the southern part of the basin, Southern Boundary fault exists with a trend approximately along WNW- ESE and has a stratigraphic throw of 1800 m towards north. The fault system dips 53° to 60°. A number of interbasinal faults also exist in the southern part. The fault angle varies from 45° to 65° with normal throw in all cases.
MORPHOMETRIC ANALYSIS
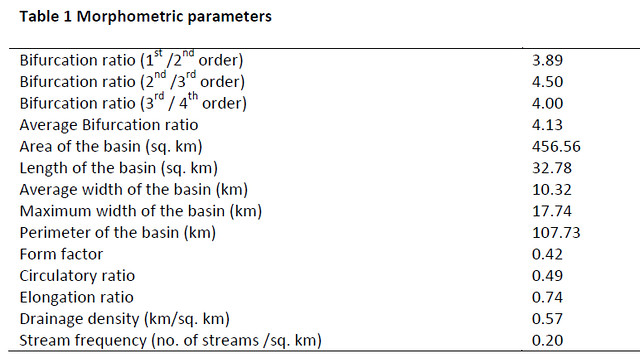
Quantitative morphometric analysis of river basin has been carried out in GIS environment for an understanding of the relationship among the different aspects of drainage parameters. Drainage channels have been classified into different orders as per Strahler’s scheme (1964). Hierarchy of stream segments has been established according to stream ordering classification scheme. Individual channel segments have been assigned a first order, joining of two such first order segments resulting to a stream of second order, two second order streams join to form a third order stream and so on. The morphometric parameters established are given in Table 1 and include bifurcation ratio, stream length, form factor, circulatory ratio, elongation ratio, drainage density and stream frequency.
Stream orders
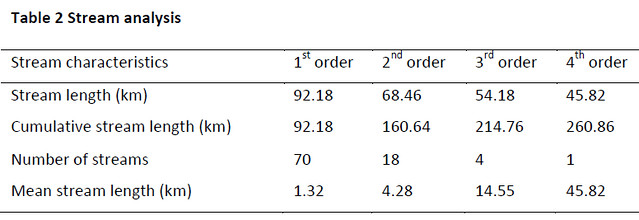
Stream order analysis based on the Strahler’s method shows that the main basin is of the fourth order to which a number of third, second and first order streams join. When the number of streams is plotted against the stream order, the drainage network exhibits a linear relationship and the plot on a semi-logarithm scale (number of streams on the logarithm scale and the order on the linear scale) approximates to a straight line. The first order streams have higher frequency than the streams of other orders.
Bifurcation Ratio (Rb)
The term bifurcation ratio (Rb) is used to express the ratio of the number of the streams of any given order to the number of streams in the next higher order (Rb = Nu / Nu+ 1), where Nu is the total number of streams of Nth order and Nu+ 1 is the total number of streams in the next higher order. Average value of the bifurcation ratio has been calculated by determining the slope of the regression line of logarithm of stream number (ordinate) and stream order (abscissa). The values of the bifurcation ratio in the study area indicate that the drainage basin has been affected by structural disturbances. Moderately high values of bifurcation ratio of the study area indicate that the basin is moderately elongated in nature.
Stream length
Order-wise stream length, cumulative stream length, number of streams, and mean stream lengths are given in Table 2. The plot of the logarithm of the cumulative stream length, mean stream length and total stream length along ordinate and stream order along abscissa for the present study basin reveals a near straight line fit. The straight line fit indicates that the ratio between the mean stream lengths and the stream order is consistent throughout the successive order of a basin and suggests that the geometrical similarity is preservedwithin the basin with increasing order.
Drainage density (Dd)
Drainage density is the measure of the length of the stream segment per unit area (Dd = L/A). In the present study area, a calculated low value of drainage density (0.57) indicates the presence of fractured, resistance permeable rocks and a low relief.
Form factor (Rf)
It is defined as the ratio of the area of the basin to the square of the length of the basin (Rf = A/ (Lb)2). Smaller the value of form factor, more elongated is the basin. Basins with high form factors have high peak flows for shorter duration, where as elongated basin with low form factor will have a flatter peak of flow longer duration. The value of the form factor in Jharia basin is 0.42, which indicate that the basin is elongated.
Circulatory ratio (Rc)
It is ratio of the area of the basin to the area of the circle having the same perimeter that of the basin. If circulatory ratio value approaches unity, it indicates that the basin shape is circular. The Jharia basin has a lower circulatory ratio of 0.49, which again indicates its elongated nature.
Elongation ratio (Re)
It is the ratio of diameter of the circle having the same area as that of the basin to the maximum length of the basin. A higher elongation ratio value indicates high infiltration capacity and low runoff conditions. The calculated value of the elongation ratio for Damodar river basin is 0.74, which indicate that the basin is of low to moderate relief, the drainage is structurally controlled and the basin is moderately elongated.
GIS APPROACH
GIS is a special case of information system where the database consists of observations on spatially distributed features, activities or events that are definable in space. It has made tremendous impact owing to its capabilities of manipulation and analysis of individual layers of spatial data and of providing tools to analyse and model the interrelationships among different layers. It is used to provide support for making a wide variety of decisions based on data that are in the form of maps, images, reports, tables and field observations.
Data layer generation
Various thematic layers have been generated from the SOI Topographic maps, GSI map of Jharia coalfield and from field data. DEM generated exhibits spatial distribution of elevation continuously over a region in digital format (Fig. 3). The contours at 20m intervals have been traced from the topographic maps and digitized, edited and rasterised in the Geomatica software. The thematic layers are then generated through data input as point data with their respective ground elevation (Z-value) and then analysed through nonlinear interpolation. The contour layer has been generated through a Triangular Irregular Network (TIN) of thepoints. The X and Y values are the two dimensional locational values of the points. The Z-value is an attribute for point data, e.g. elevation, dug well data, etc.
Litho-stratigraphy
The litho-stratigraphic map of the area has been generated from GSI map of Jharia Coalfield. The different lithologies have been traced from the geological map and digitized as an area layer and then edited resulting to a thematic map in SPANS Topographer software. The dominant lithologies include sandstone, shale and granite gneiss (basement rock). The litho-stratigraphic map of the study area is shown in Fig. 2.
Slope
Slope is the change of elevation of a surface and it is expressed as a percentage of rise over run. A value of 0% represents a slope of 00 while a value of 100% represents a slope of 450. The relationship between percentage and degrees as represented on this case is non-linear. In the present study, slope map has been generated from the DEM. Slope plays a very significant role in determining infiltration vs. runoff. Infiltration is inversely related to slope The slope map of the study area is presented in the Fig. 4, which shows an overall gentle slope towards east-southeast.
Drainage
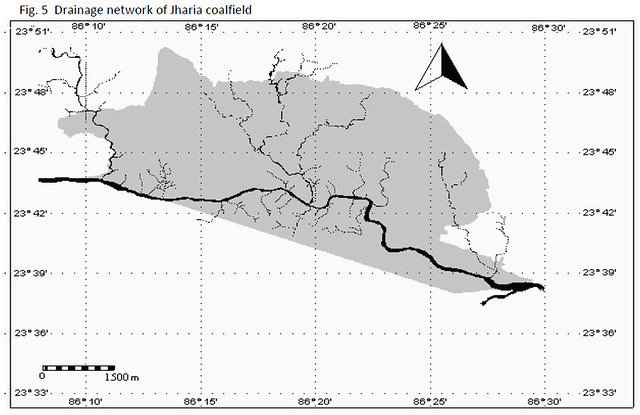
Drainage pattern of an area is very important in terms of its groundwater potentiality. It is the source of surface water and is affected by structural, lithological and geomorphological control of an area. The drainage pattern in the present study area is dendritic. This may be due to more or less homogeneous lithology and structural controls. Damodar river is the main control of drainage system along the Jharia coalfield. It is a fourth order stream to which a number of third to first order streams, viz. Jamunia, Khudia, Katri, Ekra, Tisra,Chatkari etc. join. Damodar river flows along the southern periphery of the coalfield. The main flow direction is from west to east. The drainage map of the study area is presented in Fig. 5.
Lineament
In Jharia coalfield, faults are the dominant linear feature. The Gondwana sediments of Jharia basin are largely disturbed by a large number of various types of fault system. In the southern part of the basin, Southern Boundary Fault is present with a trend approximately along WNW- ESE. A number of interbasinal faults also exist. The lineament data have been prepared by tracing various lineaments from the geological map of Jharia coalfield that have been digitized as a line layer. The fault frequency indicates the infiltration of water into thesub-surface. A high fault frequency provides an indication of higher infiltration and vice versa. The lineament map along with the litho-stratigraphic map is shown in the Fig. 2.
GIS MODELLING
Groundwater condition in various litho-units can be described under three broad divisions, viz. (i) weathered formation; (ii) fractured formation; and (iii) abandoned water logged area. To determine the status of the groundwater table, water level data have been collected from different dug wells at 46 locations of Jharia Coalfield during pre-monsoon and post-monsoon periods. The pre-monsoon and post-monsoon depth to water table map, water table elevation map, and water table fluctuation map have been generated from thewater level data
Overlay analysis
In the present study, the choice among a set of zones for evaluation of groundwater potentiality has been based upon multiple criteria such as drainage pattern, control of lithological units, steepness of slope, lineament frequency and water table elevation. The process is known as Multi-Criteria Evaluation (MCE). For a Multi-Criteria Modelling, firstly a template has been created by identifying the quadtrees used in the analysis.The number of input quadtrees that can be selected is reduced to one less than the total number. A default weight is calculated by dividing 100 by the number of quadtrees used in the overlay and is assigned to each quadtree in the analysis. A default of 0 for each class score is assigned to each quadtree class. Each class is labelled with the short legend title taken from the input quadtree. Different categories of derived thematic maps have been assigned scores in a numerical scale of 0 to 5 depending upon their suitability to holdingcapacity of groundwater. A summation of these product values led to the generation of final weight map.
Mathematically, this can be defined as:
GW = f (Dr, Lin, Lith, Sl, WTE)
where, GW is groundwater, Dr is drainage, Lin is lineament, Lith is lithology, Sl is slope and WTE is water table elevation.
The groundwater potential map value, thus derived is given by the equation:
GWP = Σ Wi CVi ; with Σ Wi = 1;
where, GWP is the groundwater potential map value, Wi is the probability value of each thematic map, and CVi is the individual capability value to hold groundwater.
Hence, the GWP estimated is given as summation of:
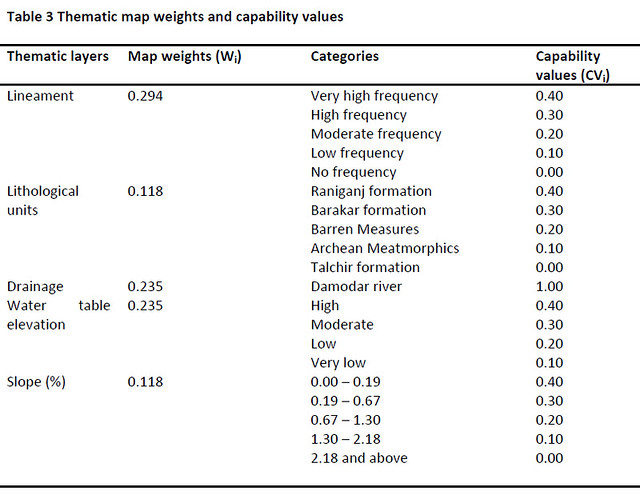
(0.294* CVLin) + (0.118* CVLith) + (0.235*CVDr) + (0.235*CVWTE) + (0.118* CVSl).
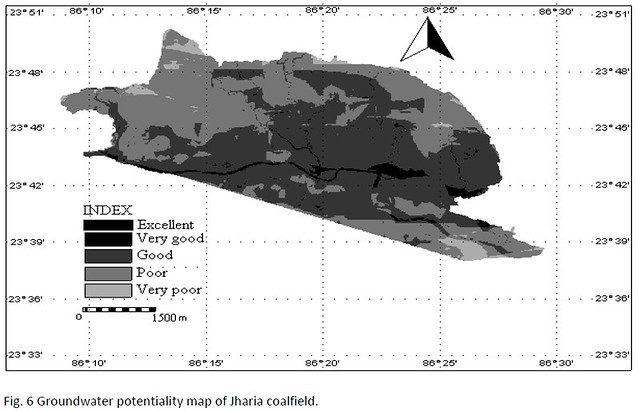
The resultant final weight map indicates the potentiality of groundwater occurrence in the Jharia Coalfield (Fig. 6).To derive the final weighted map, a probability weighted approach (Sarkar et al., 2001) has been employed that allows a linear combination of probability weight of each thematic map (W) with the individual capability value (CV).
Using Baysian statistics, the capability values have been estimated from their assigned scores in a numeric scale. These capability values have then been multiplied with respective weight of each thematic map (Table 3) to lead to generation of groundwater potentiality map. The map has been classified into five categories of potentiality, namely, Excellent, Very Good, Good, Poor and Very Poor.
RESULTS AND DISCUSSION
In weathered and fractured zones, groundwater occurs at shallow depths. The Archean metasedimentary formations, the granites and intrusive metabasics and lower Gondwana sedimentary formations constitute the productive aquifers. Groundwater occurring in the interconnected joints and fractures at shallow depths are under unconfined condition. They are connected with the overlying saturated weathered residuum. In the Archean metamorphics of the Jharia coalfield, groundwater occurs in semi-confined to confined aquifer condition. Groundwater occurs under unconfined condition in the top weathered mantle of the variegated Barren Measures and the Barakar and Raniganj sandstones except for Talchir shales. This is because the original rocks being nonporous and nonpermeable, even weathering of top layer does not become conducive to groundwater movement. It is under semi-confined condition in the deeper fractures zones that have imparted secondary porosity and permeability in these rocks. The Gondwana sandstone, in general, is knownto constitute good aquifers at many places.
The groundwater potentiality map derived employing multi-criteria evaluation technique reveals distribution of various potential zones of groundwater in and around Jharia coalfield. The northwestern and southwestern part of the basin shows poor to very poor groundwater potentiality while along the flood plain and river terraces, it shows good to excellent groundwater potentiality. In the southeastern part of the coalfield, groundwater potentiality is good though in reality many areas in the southeastern part show poor groundwater reserve. This may be due to the active mining activities in that part which have disturbed thegroundwater reserve in that area. Areas in the north-eastern part of the coalfield show good to poor groundwater potentiality. In the eastern side, some areas near the river shows excellent groundwater potentiality. More than century old coal mining activity in Jharia coalfield has substantially modified the groundwater level, movement and flow direction. Following are the observations of resultant effect of the present day set-up of ground water regime:
a) General lowering of ground water level of about 30 m depth in the undisturbed zone in colliery area in comparison with the disturbed zone, because of underground mining activity up to an average depth of 150 to 200 m.
b) Re-circulation of pumped out groundwater from mines and discharging to surface drainage system, followed by percolation through fracture system and again recharging to neighbouring mines as well as in the periphery of the same mine.
c) Main flow of the groundwater in Jharia coalfield is through a networking of existing fault system with 275 nos. of such faults of varying throw.
CONCLUSION
Following concluding remarks can be made from the morphometric analysis and the groundwater potentiality mapping study:
a) Morphometric analysis of Jharia coalfield reveals a drainage basin with low to moderate relief, dendritic pattern, structural control, and being mainly composed of fractured and permeable resistant rocks;
b) Flood plains, abandoned river channels, valley flats provide potential groundwater zones;
c) Generally, 60 to 70 years old goaf filled with water has become part of the present day groundwater regime resulting in high potential source of groundwater that can be exploited for the use of the society.
d) Quality of water, in general, in the very old goaf is potable but it may be analysed and subject to water treatment for use of the society wherever necessary.
ACKNOWLEDGEMENTS
The author acknowledges Department of Applied Geology, Indian School of Mines, Dhanbad for providing necessary laboratory facilities and to M/s Bharat Coking Coal Limited, Dhanbad for necessary data support.
REFERENCES
- Chandra, D., 1992. Jharia Coalfield, Geological Society of India, Bangalore, pp. 4 – 35.
- Fox, C.S., 1930. The Jharia Coalfield. Memoir Geological Survey of India, vol. 56, 255 pp.
- Mehta, D.R.S. and Murthy, B.R.N., 1957. A revision of the geology and coal resources of the Jharia coalfield, Memoir Geological Survey of India, vol. 84, Part. 2, 142 pp.
- NRIMS, 1995. Report on the soils of Jharia coalfield, Natural Resources Information Management Services, Hyderabad, Part a, pp. 1-5, 12-14, 25-26, 32, 61-68, 79-83.
- Sarkar, B.C., Deota, B.S., Raju, P.L.N. and Jugran, D.K., 2001. A geographic information system approach to evaluation of groundwater potentiality of Shamri micro-watershed in the Shimla taluk, Himachal Pradesh., Journal of the Indian Society of Remote Sensing, vol. 29, no. 3, pp. 151-163.
- Strahler, A. N., 1964. Quantitative geomorphology of drainage basins and channel network, Handbook of Applied Hydrology; ed. Ven Te Chow, McGraw Hill Book Company, New York, 275 pp.
- Verma, R. P., Jaipuriar, A. M., Paul, P. R., 1989. Compendium on updated and revised geology of Jharia coalfield. Central Mine Planning and Designing Institute Ltd., Ranchi, 282 pp.
B. C. Sarkar
Department of Applied Geology, Indian School of Mines, Dhanbad
Posted by


